Even and Odd Functions Using a Graph
Description/Explanation/Highlights
Video Description of Even and Odd Functions Using a Graph
This video explains how to determine even and odd functions using a graph.
Steps and Key Points to Remember to Determine Even and Odd Functions Using a Graph
To determine if a function is even, odd, or neither using a graph, follow these steps:
- If a function is odd, the graph of the function has 180 degree rotational symmetry around the origin as a result.
- Likewise, graphs of functions that have symmetry over the y-axis are even functions.
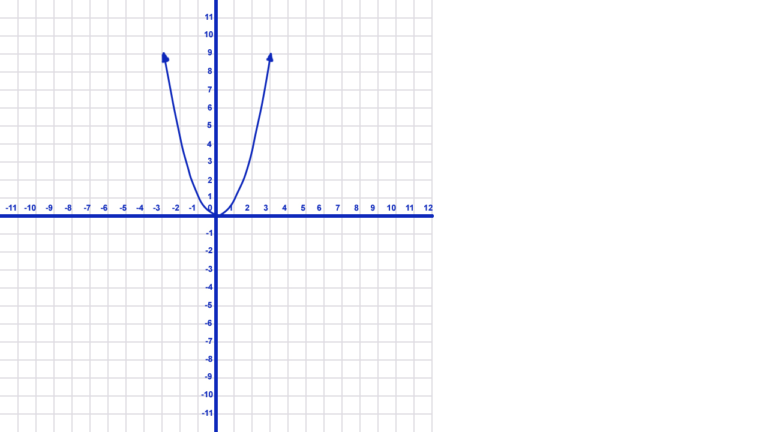
- The graph above represents an even function. Therefore, every point in quadrant I (x, y) has a corresponding point in quadrant II with a negative value of x. At the same time, it has the same value for y (-x, y). Moreover, it has reflectional symmetry over the y-axis making it the graph of an even function.
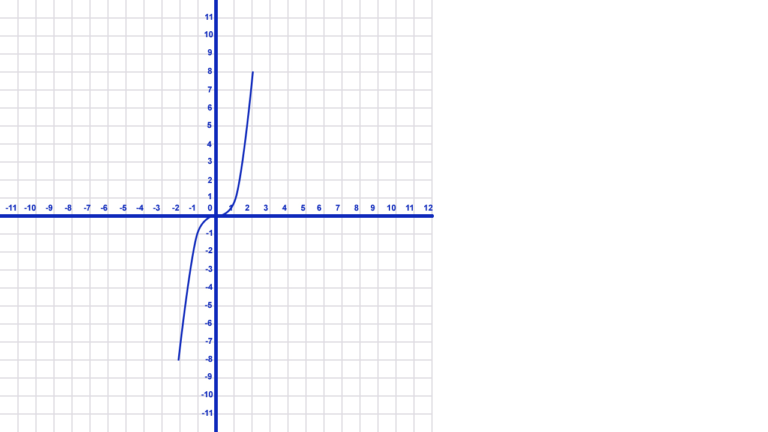
- The image above represents an odd function. Therefore, every point (x, y) in quadrant I has a corresponding point in quadrant III with a negative value of x and a negative value of y (-x, -y). The graph therefore has 180 degree rotational symmetry around the origin. This makes it the graph of an odd function. Also, note that if you rotate the graph 180 degrees, the graph is the same as the original.
Interested in learning to create your own WordPress website or blog in quick, easy lessons?
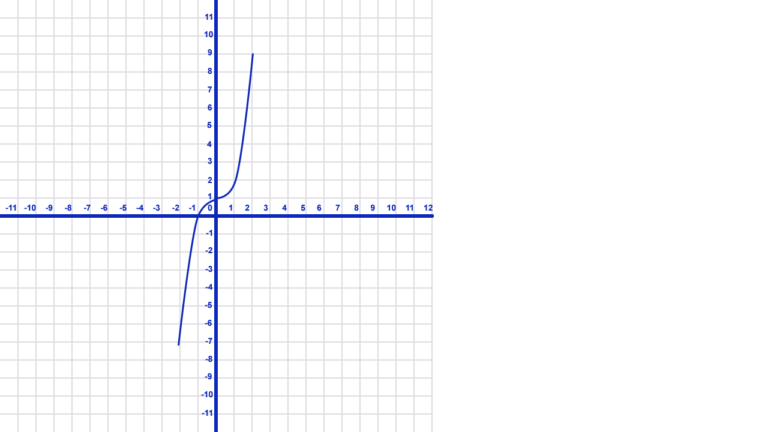
- The graph above represents a function that is neither even nor odd. First, points in quadrant I do not have points in quadrant II that represent (-x, y). This means that there is no reflectional symmetry over the y-axis. Secondly, points in quadrant III also do not correspond to points (-x, -y). In addition, a 180 degree rotation of the graph does not produce a graph identical to the original. The graph is not odd. The function graphed above is therefore classified as neither even nor odd.
Here are some key points to keep in mind when determining even and odd functions using a graph:
- A graph is symmetric over the y-axis, the graph therefore, represents an even function.
- Similarly, a graph represents an odd function if a graph is symmetric over the origin.
- Also, the graph of an even function has a negative x-value (-x, y) corresponding to every original x-value. It also has the same y-values (x, y) for each. This creates a graph with reflectional symmetry over the y-axis.
- Finally,the graph of an odd function has negative values of x and y (-x, -y) that correspond to x and y values (x, y). This creates 180 degree rotational symmetry and is odd.
Video Highlights
- 00:00 Introduction
- 00:25 Explanation of even and odd function graphs
- 00:43 Example of a graph of an even function
- 01:25 Example of the graph of an odd function
- 02:40 Example of the graph of a function that is neither even nor odd
- 04:09 Conclusion
To watch this video on YouTube in a new window with clickable highlights, click here