Increasing and Decreasing Intervals
Description/Explanation/Highlights
Video Description of Increasing and Decreasing Intervals
This video explains how to identify increasing, decreasing, as well as constant intervals on a graph.
Steps and Key Points to Remember to Determine Increasing and Decreasing Intervals
To determine intervals of a graph, follow these steps:
- Intervals on a graph refer to the parts of the graph that are moving up, down, or staying flat as the graph is read from left to right.
- As the value of x increases, increasing intervals occur when the values of y are also increasing.
- Decreasing intervals occur when the values of y are decreasing.
- Constant intervals occur when the y-values stay the same as x-values increase.
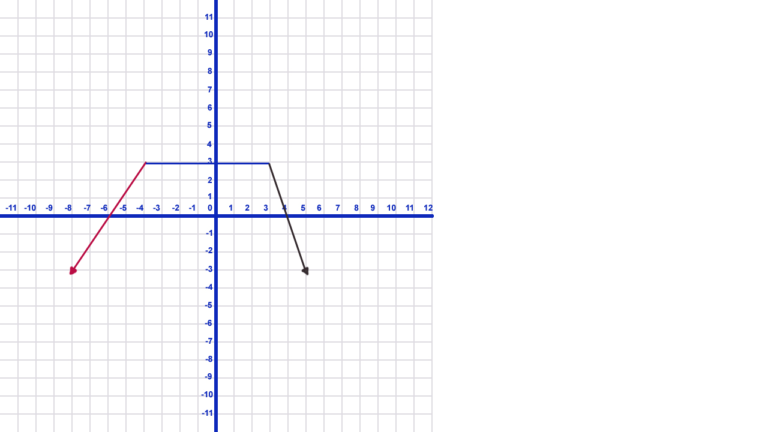
- In the graph above, the graph increases over the part that is drawn in red.
- The graph stays constant on the blue line.
- It decreases on the black part.
- First, the graph increases on the interval from negative infinity to -4.
- Secondly, the graph is constant on the interval from -4 to 3.
- Thirdly, the graph decreases on the interval from 3 to positive infinity.
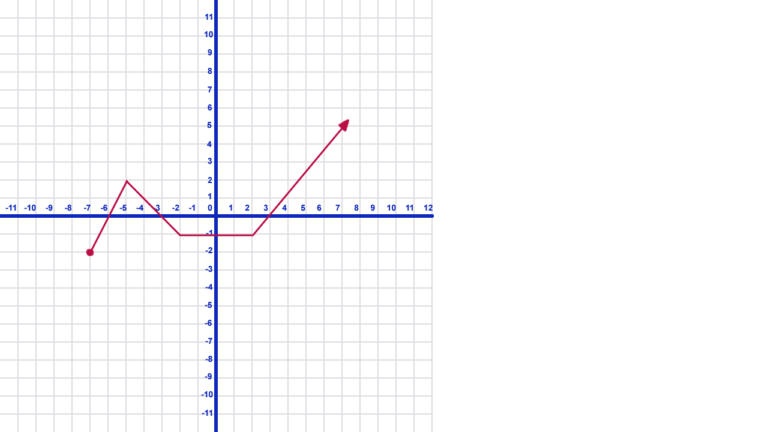
- To identify the intervals in the graph above, look from left to right. Notice that there are no y-values defined for x until x reaches -7.
- The y-values get larger until x reaches -5. This is an increasing interval.
- Notice that the y-values also increase from 2 to positive infinity. Note the arrow on the right end of the graph on x. This is also an increasing interval.
- Write these increasing intervals in interval notation as: (-7, -5), (2, \(\infty\)). Notice that we always use parenthesis and not brackets when writing intervals. The point where the graph changes direction is never increasing or decreasing. It is just a point!
- This graph only has one decreasing interval, from -5 to -2 on x which is written as (-5, -2).
- There is also a constant interval where the y-values are not changing. This occurs on the interval (-2, 2).
Interested in learning to create your own WordPress website or blog in quick, easy lessons?
Here are some key points to keep in mind when determining intervals on a continuous graph:
- Always look at the graph from left to right when identifying intervals.
- The intervals are identified by the x-values while looking at what y-values are doing as x-values increase.
- All defined intervals on a continuous graph either increase, decrease, or stay constant.
- Intervals are identified from the x-value of the point where y starts to increase, decrease, or stay constant, and by the x-value where the direction changes when observing left to right.
- Usually, write identified intervals in interval notation.
- When writing intervals in interval notation, always use parenthesis on both ends. This is because the x-value of the beginning and ending point is neither increasing nor decreasing.
Video Highlights
- 00:00 Introduction
- 00:15 Explanation of intervals
- 00:32 Example graph with increasing, decreasing, and constant intervals
- 01:49 Example of identifying intervals on a graph and writing in interval notation
- 05:12 Conclusion
To watch this video on YouTube in a new window with clickable highlights, click here