End Behavior of a Function (Using Graphs and Tables)
end behavior of a function
Description/Explanation/Highlights
Video Description of End Behavior of a Function
This video explains end behavior of a function using graphs and tables.

Steps and Key Points to Remember When Determining End Behavior of a Function Using Graphs and Tables
To determine end behavior of a function using graphs and tables, follow these steps:
- End behavior of a function refers to observing what the y-values do as the value of x approaches negative as well as positive infinity.
- As a result of this observation, one of three things will happen. First, as x becomes very small or very large, the value of y will approach \(-\infty\). Secondly, it may approach \(\infty\). Finally, it may approach a number.
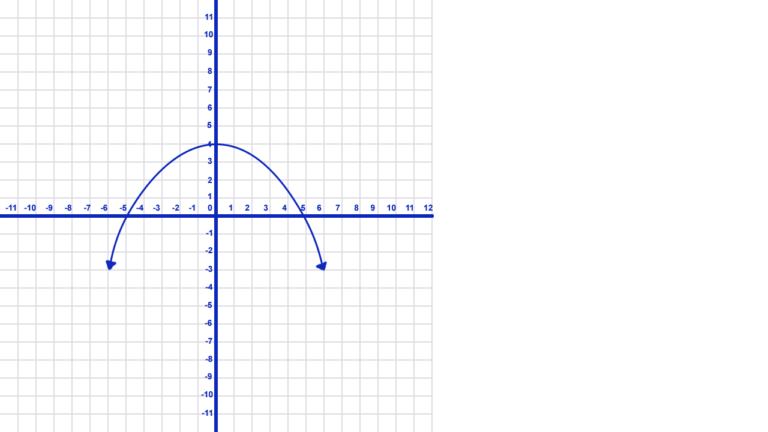
End Behavior of a Function Where Both Move toward Negative Infinity

- In the graph above, as the value of x gets smaller (to the left), the value of y also get smaller. However, as the value of x gets larger (to the right), the value of y gets smaller in contrast.
- As a result, we write: \(x\rightarrow-\infty \ y\rightarrow -\infty \\ x\rightarrow\infty\ y\rightarrow -\infty\)
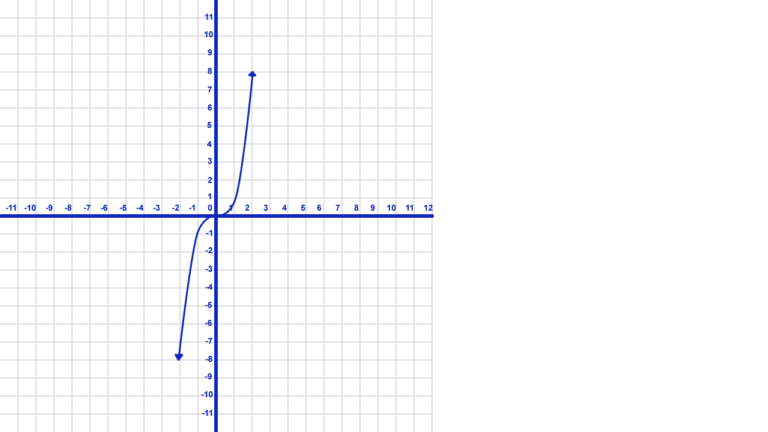
End Behavior Where One Moves Toward Negative Infinity, One Toward Positive Infinity

- As x gets smaller (moving toward negative infinity) in the graph above, similarly the value of y also gets smaller. In the same way, as the value of x gets larger (moving toward infinity), likewise, the value of y gets larger.
- Therefore, we write this as: \(x\rightarrow-\infty \ y\rightarrow -\infty \\ x\rightarrow\infty\ y\rightarrow \infty\)
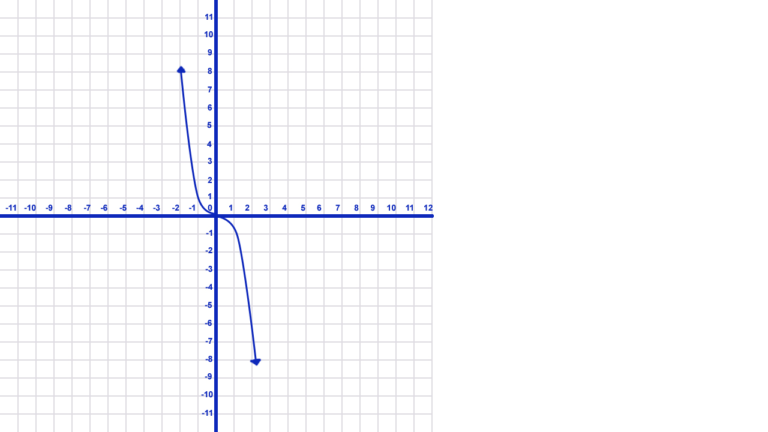
End Behavior of a Function Where One Moves Toward Positive Infinity, One Toward Negative Infinity

- If we reflect the previous graph over the y-axis, as a consequence, the end behavior is reversed. Therefore, as x gets smaller, y now gets larger. and as x gets larger, y, at the same time, gets smaller.
- As a result, we write: \(x\rightarrow-\infty \ y\rightarrow \infty \\ x\rightarrow\infty\ y\rightarrow -\infty\)
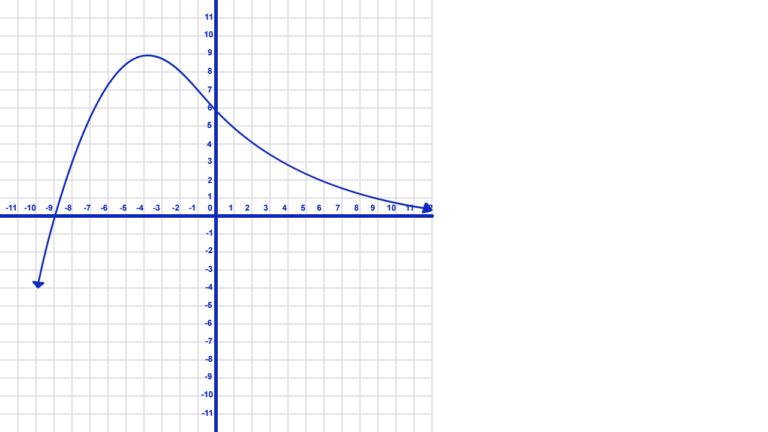
End Behavior Where One Moves Toward Negative Infinity, One Toward a Number

- Finally, notice how in the graph above the values of y go toward negative infinity as the values of x move in the same direction. However, this time as x gets larger, the graph begins to flatten out and actually approach the x-axis or \(y=0\).
- We write this as: \(x\rightarrow-\infty \ y\rightarrow -\infty \\ x\rightarrow\infty\ y\rightarrow 0\)
- In the graph above, it is pretty easy to tell that the y-values are approaching 0 as x increases. However, to be sure (or if the number is impossible to tell accurately by looking at the graph), use a table of values to determine the endpoint behavior.
- In the example, \(f(x)=\frac{\textstyle 3x+2}{\textstyle 2x-3}\), it is hard to tell what the graph is approaching when looking at a graph on a calculator. Consequently, we will create a table of large and small values to get a better look.
- First, start with small values of x to see what the graph is doing as x approaches negative infinity. Then do a table of large values to see what y does as x approaches positive infinity.
X
-500
-1000
-1500
-2000
Y
1.4935
1.4968
1.4978
1.4984
X
500
1000
1500
2000
Y
1.5065
1.5033
1.5022
1.5016
- As the values of x become smaller and smaller in the first table, the values of y, as a result, get closer and closer to 1.5 from just below 1.5. Furthermore, as the values of x get larger and larger in the second table, the values of y get closer and closer to 1.5 from just above it.
- As a result, we write this as: \(x\rightarrow-\infty \ y\rightarrow 1.5 \\ x\rightarrow\infty\ y\rightarrow 1.5\)
Interested in learning to create your own WordPress website or blog in quick, easy lessons?
Here are some key points to keep in mind when determining endpoint behavior of a function:
- When using a graph look at what the y-values of the graph do as it moves to the far left and far right of the graph.
- The graph will approach \(-\infty\), \(\infty\), or some constant value (number).
- This behavior is determined as x-values increase or decrease to very large or very small values. Likewise, the end behavior is based on what the y-values do.
- When trying to determine end behavior from a table, substitute small and large values for x. Then, look at the results for y.
- The y-values will either continue to increase (approaching \(\infty\)), continue to decrease (approaching \(-\infty\), or they will approach a constant value.
Video Highlights
- 00:00 Introduction
- 00:09 Explanation of what end behavior is and how to determine it
- 01:58 Example of a graph that approaches negative and positive infinity
- 03:02 Another example of a graph approaching both negative and positive infinity
- 03:32 Example of a graph that approaches a constant value (y=0)
- 05:00 \(f(x)=\frac{\textstyle 3x+2}{\textstyle 2x-3}\) example of determining end behavior of a function using a table
- 08:00 Conclusion
To watch this video on YouTube in a new window with clickable highlights, click here
